

| Original Image | 2D FFT | Spectral Slope | Entropy | Kurtosis | Moments |
|---|---|---|---|---|---|
|
|
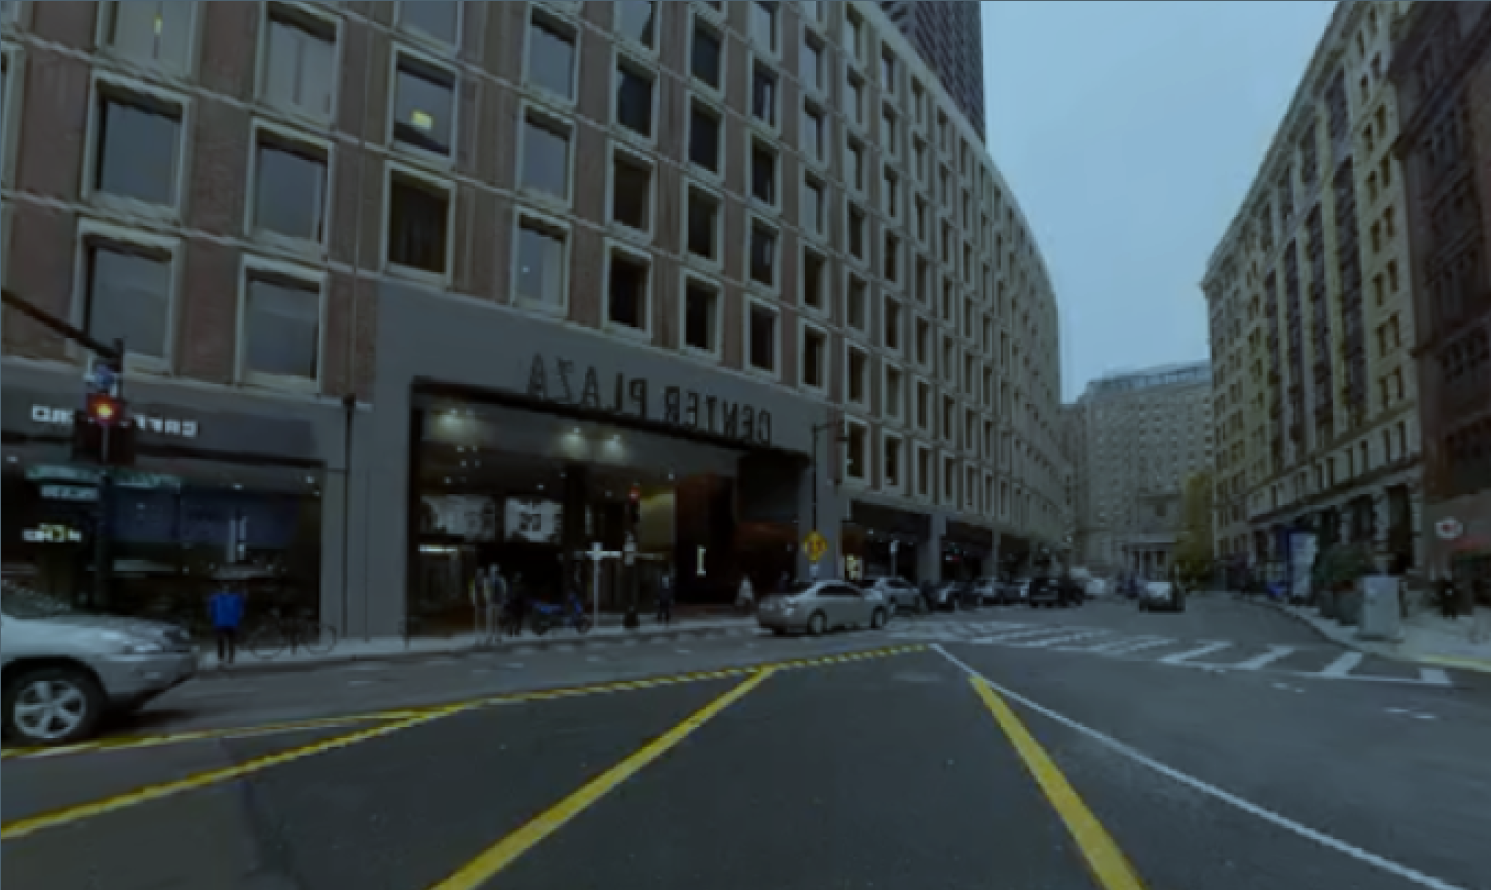
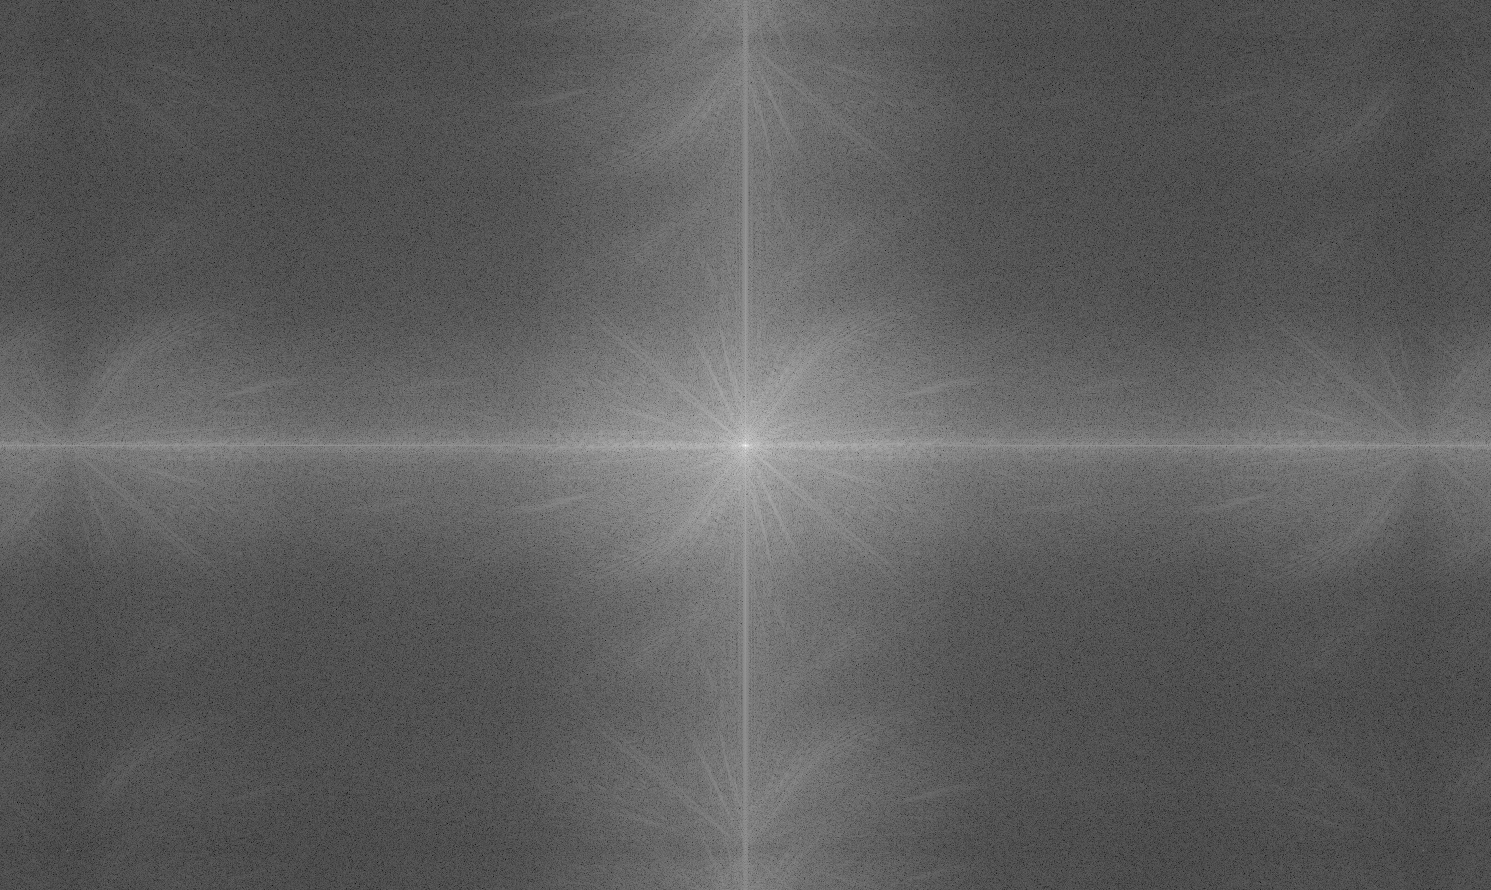
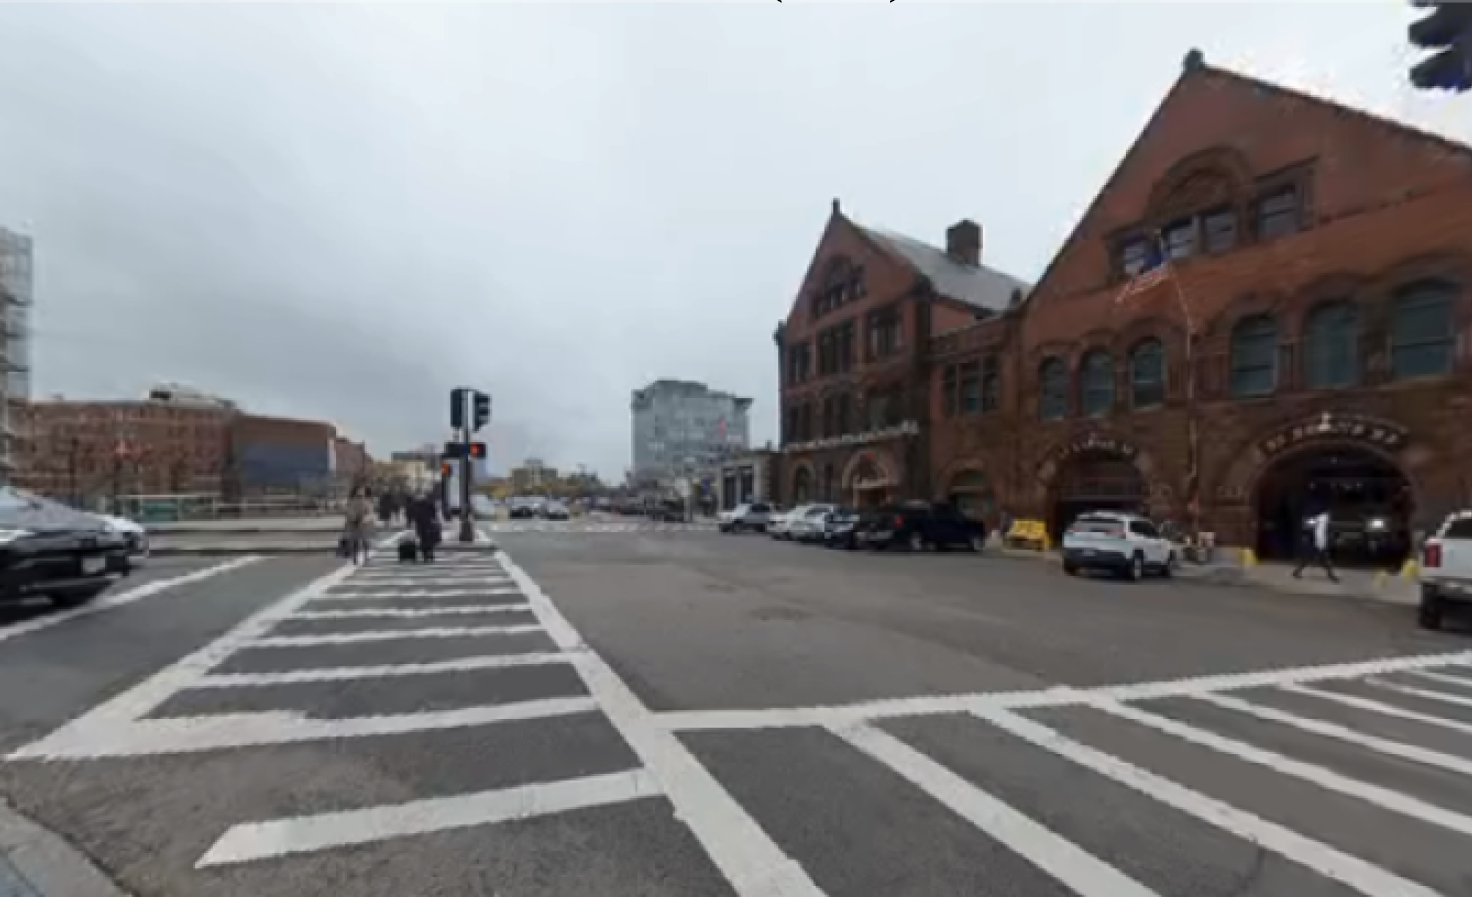
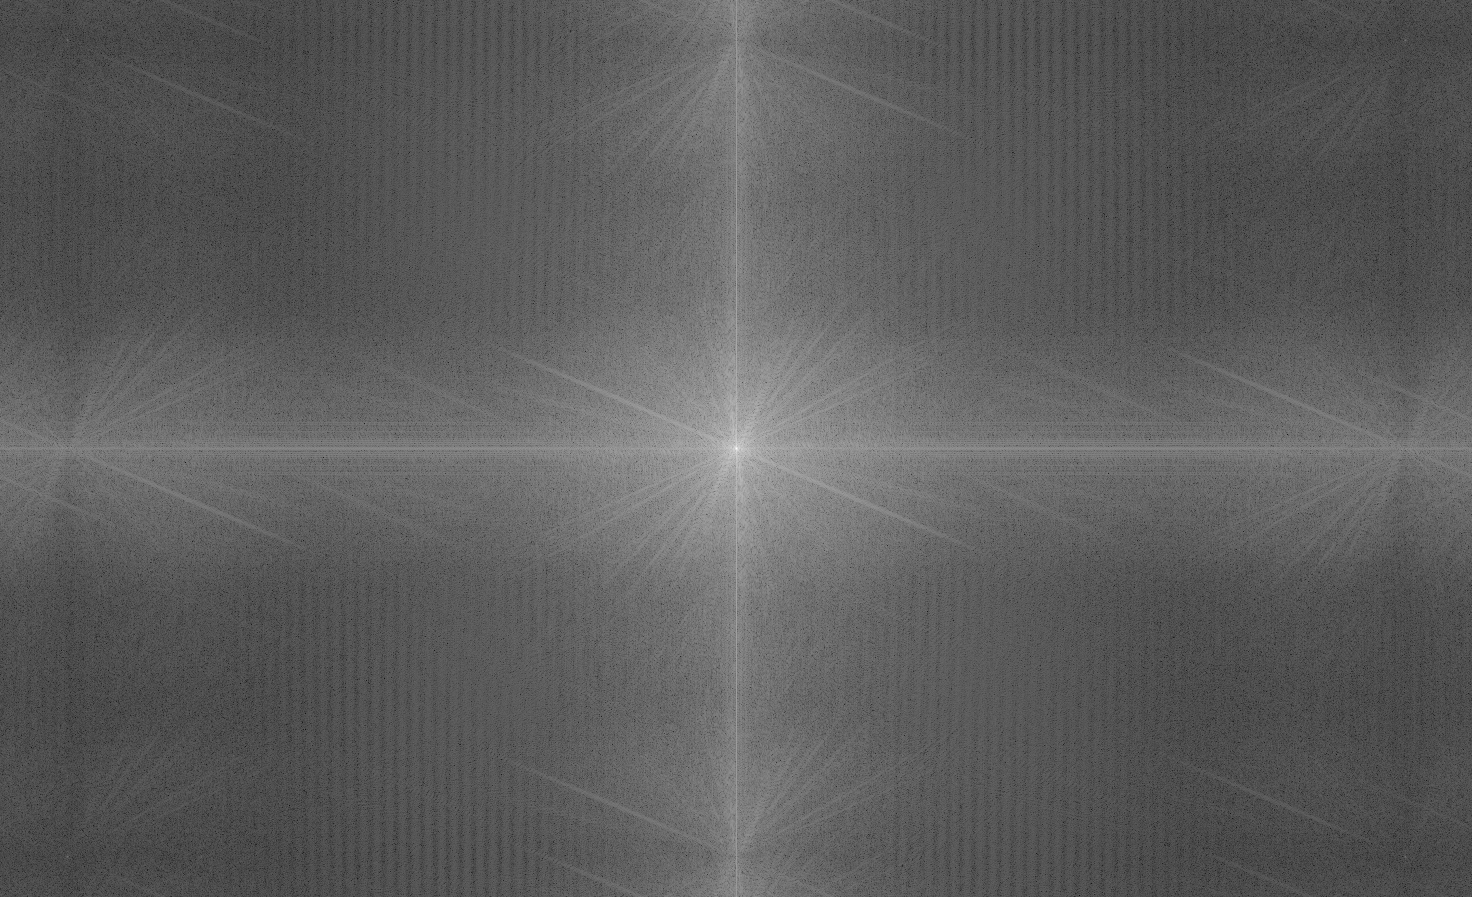
1.0076 | 6.7895 | 2.0498 | 7.83e+09, 4.72e+25, 3.72e+41, 2.94e+57 |
|
|
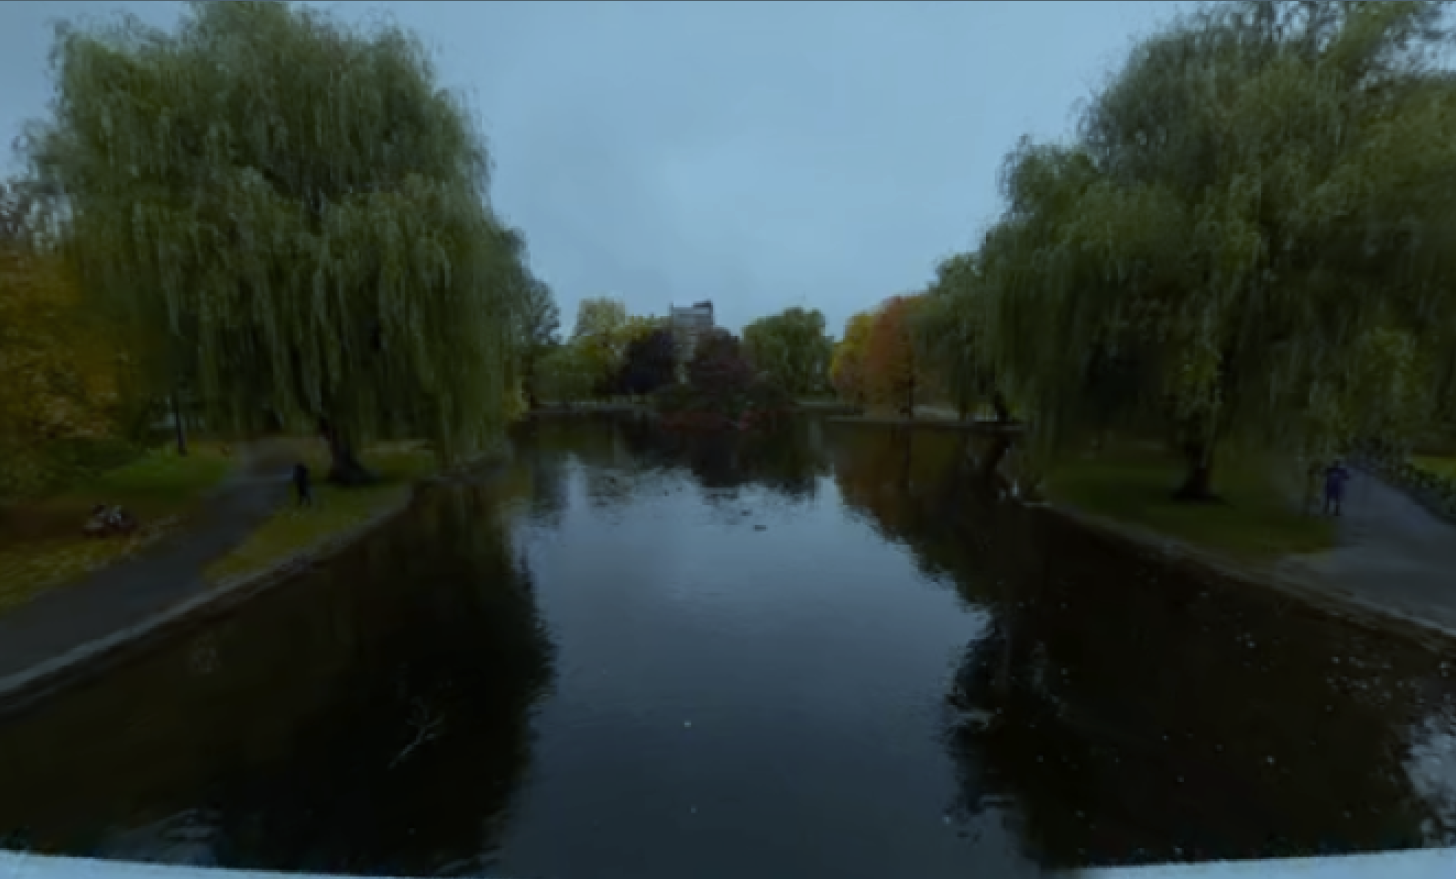
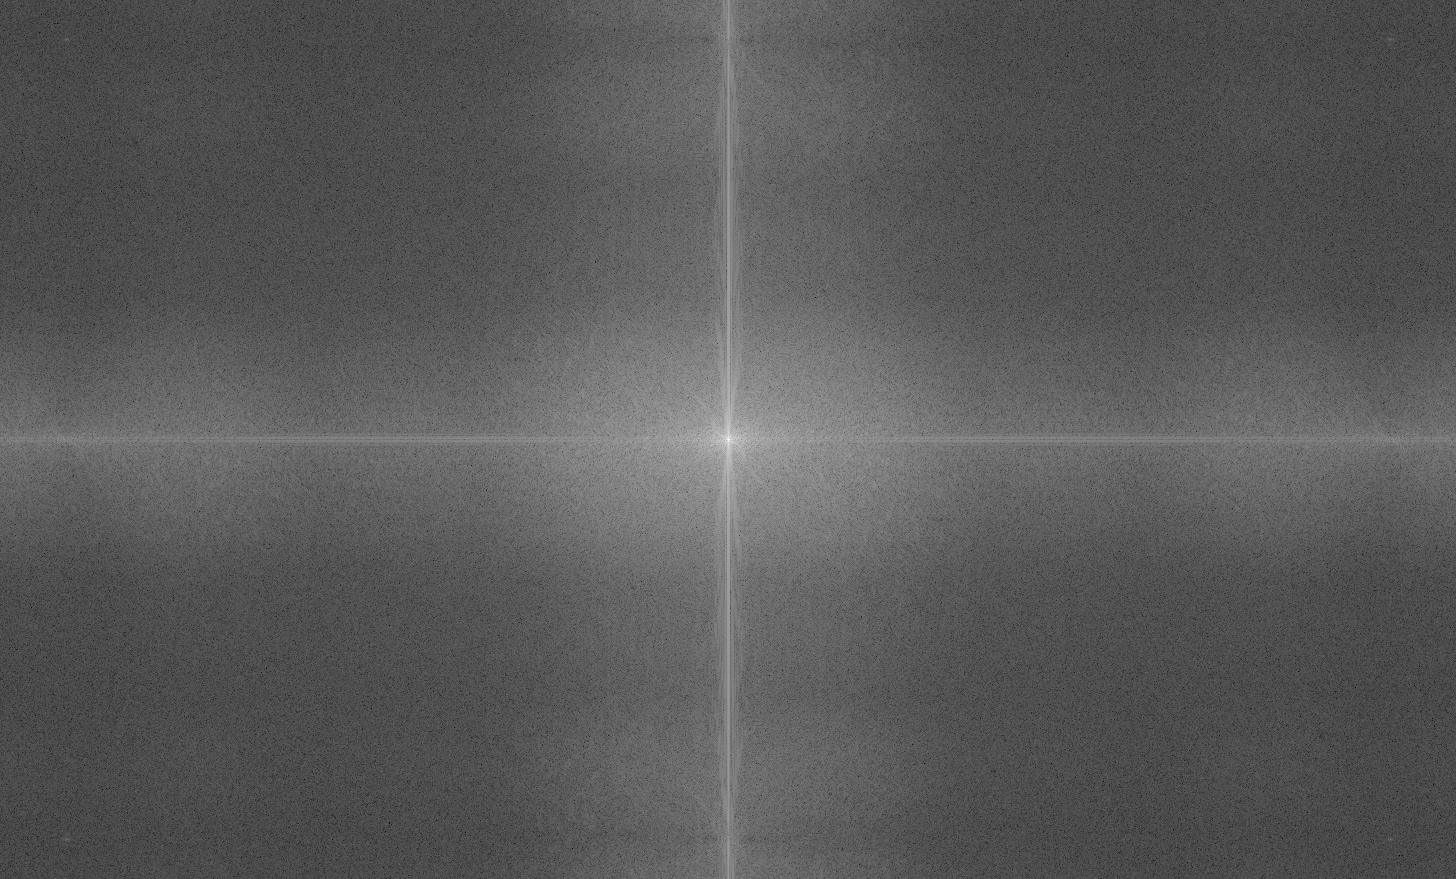
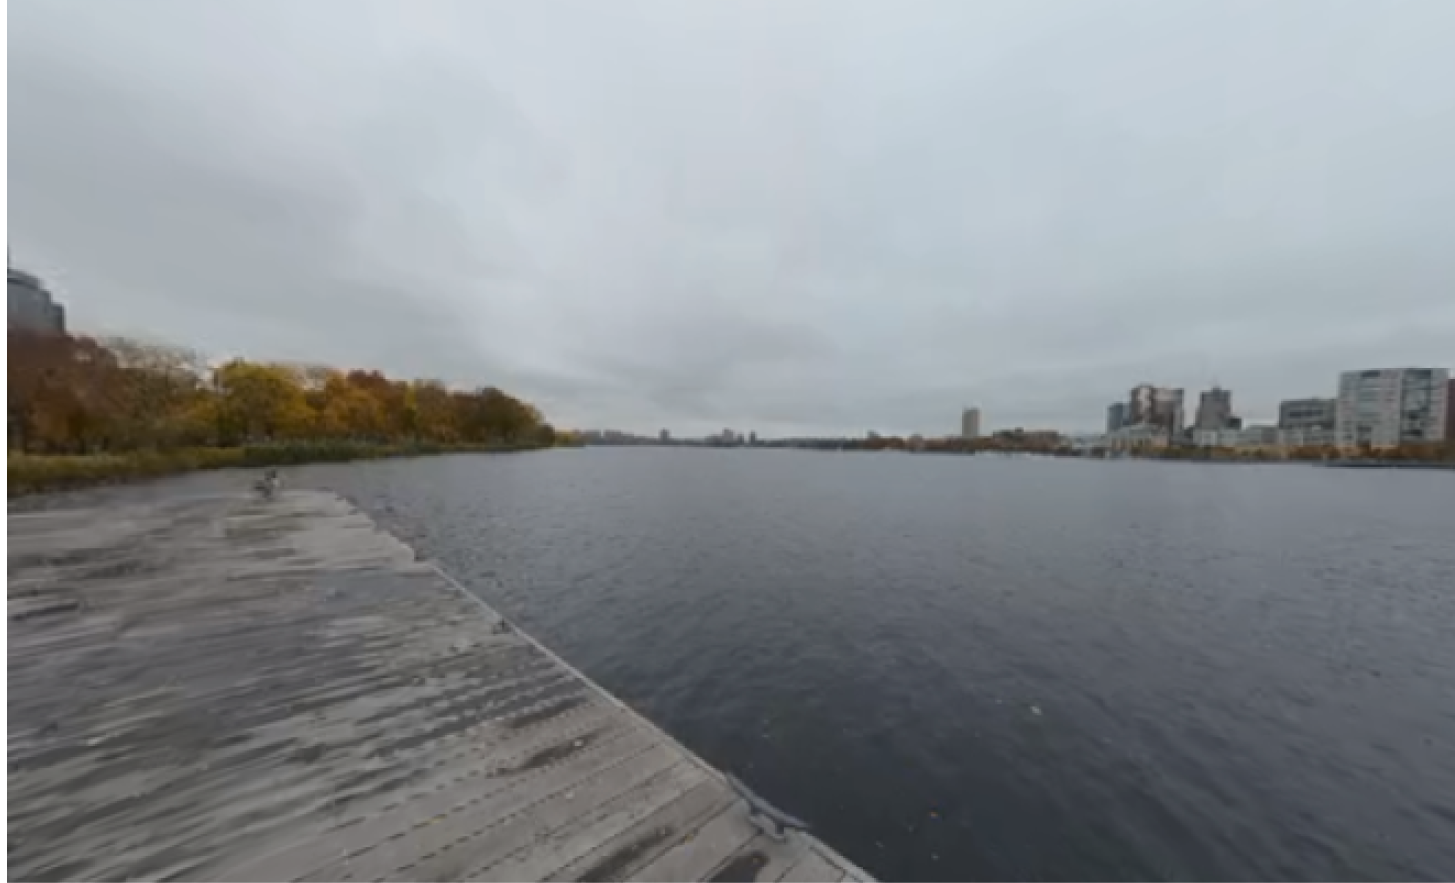
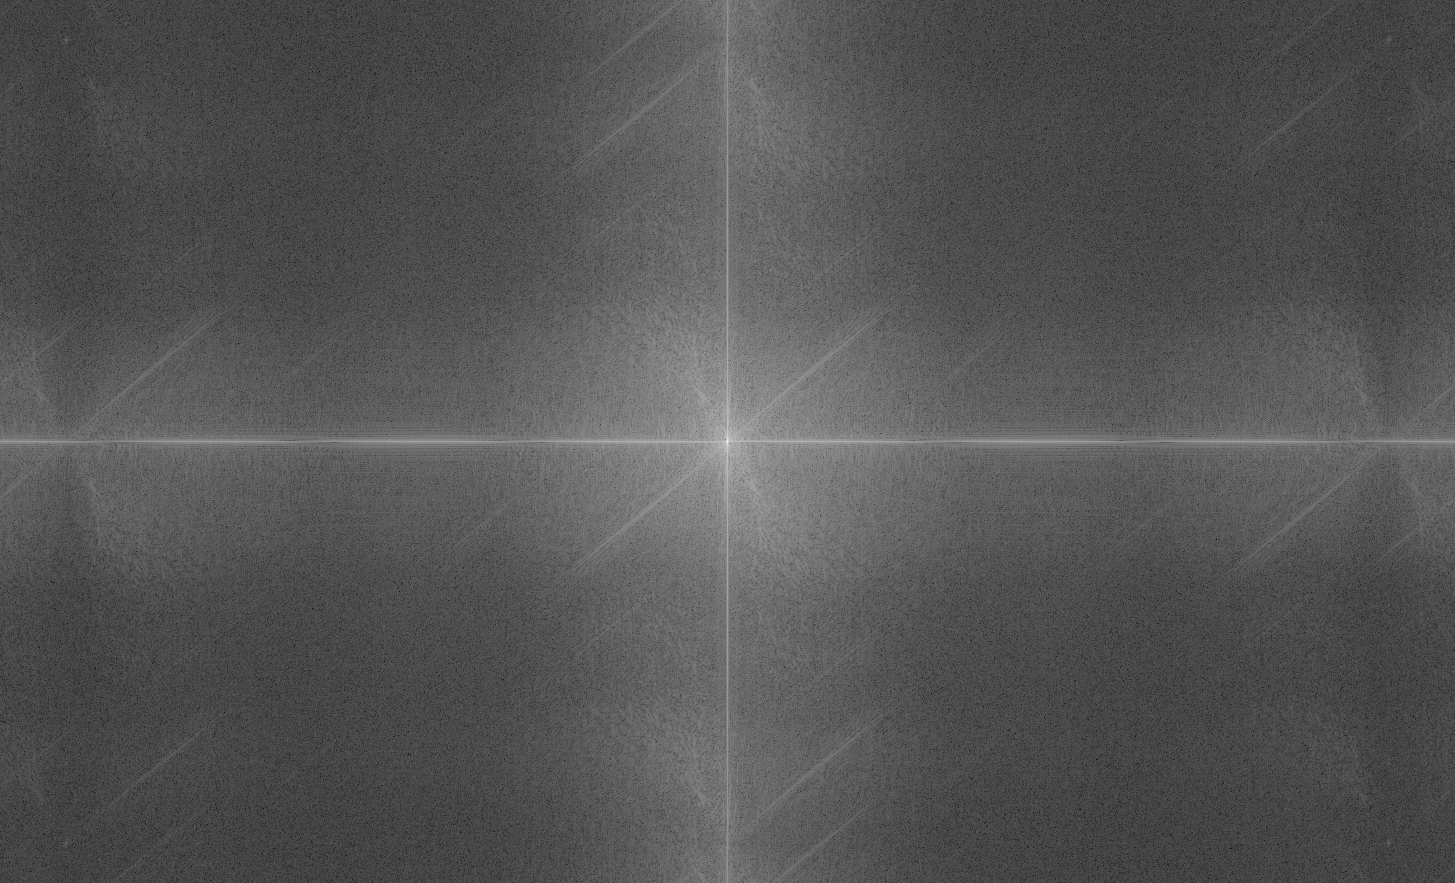
0.8608 | 6.7607 | 0.1208 | 7.66e+09, 2.47e+25, 1.32e+41, 7.30e+56 |
|
|
0.8404 | 7.5126 | -1.3726 | 2.99e+10, 7.36e+26, 2.28e+43, 7.09e+59 |
|
|
0.9395 | 7.1387 | -1.4010 | 2.88e+10, 8.15e+26, 2.62e+43, 8.47e+59 |
|
|
0.0429 | 7.4510 | 0.7445 | 4.23e+09, 4.55e+24, 7.10e+39, 1.11e+55 |
|
|
0.3357 | 7.8067 | -1.1453 | 2.74e+09, 7.33e+23, 2.66e+38, 9.65e+52 |
|
|
0.3053 | 7.4908 | 0.4256 | 2.17e+09, 5.27e+23, 1.62e+38, 4.99e+52 |
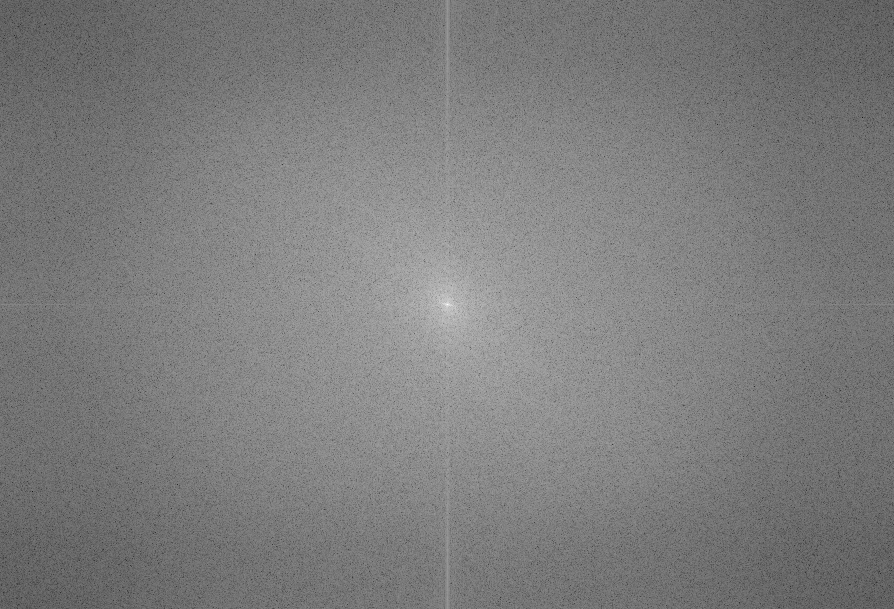
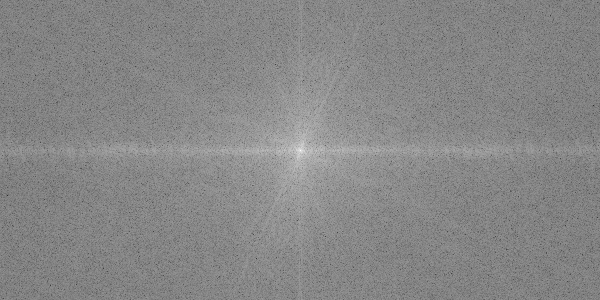
The 2D FFT converts an image from the spatial domain to the frequency domain. In the FFT image:
The power spectrum is the squared magnitude of the FFT. It shows the distribution of power (intensity) across different frequencies in the image.
The spectral slope indicates how quickly the power decreases as frequency increases. A more negative slope suggests a smoother image with less high-frequency content.
Entropy measures the amount of information or complexity in the image. Higher entropy indicates more complex or random pixel distributions, while lower entropy suggests more uniform or predictable patterns.
Kurtosis measures the "tailedness" of the pixel intensity distribution. High kurtosis indicates a distribution with heavy tails and a sharp peak, suggesting the presence of outliers or extreme values in pixel intensities.
The moments provide statistical information about the distribution of frequencies in the image:
Note: The 4th moment here is the kurtosis calculated against the FFT, which differs from the kurtosis of pixel intensities in the spatial domain.
These metrics together provide a comprehensive view of an image's characteristics: